

A few years ago, I woke up to a flood of angry messages from family members. My self-hosted Nextcloud server had crashed in the middle of the night, taking our shared family calendar and photo backups down with it.
I didn’t know it was down until someone complained. That’s a terrible feeling.
If you run any self-hosted service — whether it’s a Vaultwarden password vault, a Jellyfin media server, or a production Coolify deployment — you need to know before your users do when something breaks.
You could pay a commercial service like UptimeRobot or Pingdom to monitor your sites, but they route your infrastructure’s availability data through third-party servers and gate basic features (like SMS or Telegram alerts) behind a paywall.
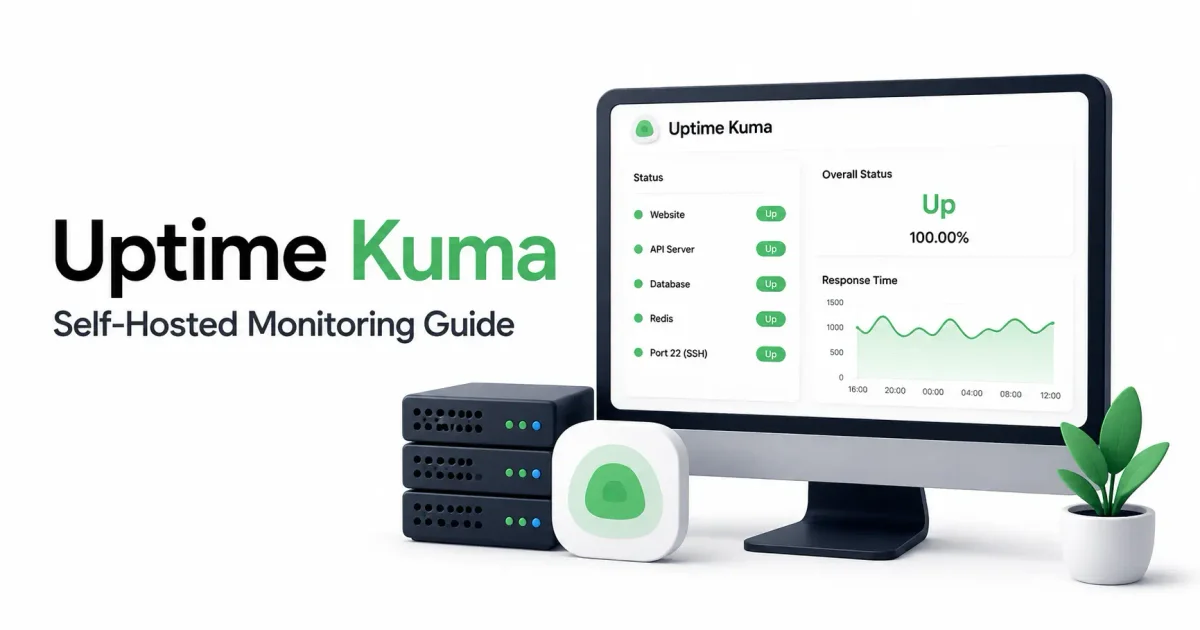
Uptime Kuma is the self-hosted answer. It’s a gorgeous, lightning-fast open-source monitoring tool that you run on your own hardware. In this guide, I’ll show you exactly how to set it up, connect your notification channels, and build a public status page that rivals enterprise tools.
Why Uptime Kuma?
The monitoring landscape has been dominated by massive enterprise solutions for a long time. If you didn’t want to learn Prometheus and Grafana, you just paid for UptimeRobot.
Uptime Kuma fixes this. It’s built on Node.js and SQLite, meaning it runs perfectly as a single, lightweight Docker container. It requires almost zero maintenance.
Here is what makes it the standard for Proxmox home labs and small businesses:
- It monitors everything → HTTP(s) websites, TCP ports, ICMP ping, DNS records, and even local Docker containers.
- Real-time dashboard → Built with Vue.js and Socket.io, the dashboard updates instantly without refreshing.
- Over 90 notification providers → Telegram, Discord, Slack, email, Gotify, ntfy, Signal, Webhooks… if it can receive a message, Uptime Kuma supports it.
- Public status pages → Build beautiful, public-facing status pages mapped to your custom domain, completely free.
- Zero data lock-in → Your uptime history stays on your Linux VPS or home server.
Server Requirements
Unlike AI tools like OpenWebUI or heavy photo organizers like Immich, Uptime Kuma sips resources.
- CPU: Any x86 or ARM CPU (runs beautifully on a Raspberry Pi).
- RAM: 512MB is plenty for monitoring a dozen services.
- Storage: Under 1GB. The SQLite database grows very slowly.
- OS: Any Linux distro with Docker installed.
If you are starting from scratch, read our Ubuntu Docker installation guide or explore the Docker vs Podman comparison if you prefer daemonless containers.
Installing Uptime Kuma with Docker
We will use Docker Compose to spin up Uptime Kuma. If you aren’t comfortable writing YAML, you can always use our Docker Compose generator to scaffold your files.
First, create a directory for your configuration:
mkdir -p ~/uptime-kuma
cd ~/uptime-kuma
Create the Compose file using Micro or Nano:
micro docker-compose.ymlPaste the following configuration:
version: '3.8'

services:
  uptime-kuma:
    image: louislam/uptime-kuma:1
    container_name: uptime-kuma
    volumes:
      - ./uptime-kuma-data:/app/data
      # Optional: Mount the docker socket to monitor local containers directly
      - /var/run/docker.sock:/var/run/docker.sock:ro
    ports:
      - 3001:3001
    restart: unless-stopped
    security_opt:
      - no-new-privileges:true
Understanding the Config
- Data Volume: We mount
./uptime-kuma-datato/app/data. This directory will hold thekuma.dbSQLite file containing all your history and settings. If you wipe the container, your data survives. - Docker Socket: Mounting
/var/run/docker.sockallows Uptime Kuma to talk to the Docker daemon. This lets you monitor if specific containers (like your Portainer instance) go down, even if they aren’t exposed to the internet. We mount it read-only (:ro) for security. - Port 3001: We expose the web interface on port 3001. We will put this behind a reverse proxy later so you don’t expose raw ports to the web.
Start the container:
docker compose up -dVerify it is running by checking the Linux system logs:
docker compose logs -fInitial Setup & Your First Monitor
Navigate to http://<your-server-ip>:3001 in your browser.
You’ll be prompted to create an admin account. Use a strong password. If you need one, our password generator handles that, and you can review the best password managers to store it securely.
Once inside the dashboard, let’s create a basic monitor for a website.
- Click Add New Monitor in the top left.
- Monitor Type: Select
HTTP(s). - Friendly Name: e.g., “My Tech Blog”.
- URL:
https://yourwebsite.com. - Heartbeat Interval: 60 seconds is standard.
- Retries: Set this to 3. (This means the site must fail 3 consecutive checks before sending an alert, preventing false positives from minor network blips).
- Click Save.
The dashboard will immediately ping the site and update the graph to green. You now have basic uptime monitoring.
Advanced Monitor Types
Uptime Kuma isn’t limited to HTTP checks:
- Ping: Great for checking if your router or Pi-hole is online on the local network.
- TCP Port: Verify if your SSH server (port 22) or game server is accepting connections without checking HTTP headers.
- DNS: Query a specific DNS server to ensure your domain records are resolving correctly. Useful if you’ve recently learned how DNS works.
- Docker Container: Because we mounted the Docker socket, you can select a local container name (like
nginx-proxy-manager) and monitor its exact state.
Configuring Notifications (The Most Important Step)
A monitoring dashboard is useless if you have to look at it to know something is broken. You need push notifications.
Uptime Kuma supports dozens of providers, but Telegram and Discord are the most popular and easiest to set up.
Setting Up Telegram Alerts
- Open Telegram and search for the
@BotFather. - Send
/newbot, give it a name, and copy the HTTP API Token. - In Uptime Kuma, click the user menu (top right) → Settings → Notifications.
- Click Setup Notification.
- Set the type to Telegram.
- Paste your Bot Token.
- Click the “Get Chat ID” button in Uptime Kuma to message a helper bot that returns your personal Chat ID. Enter that ID.
- Click Test and wait for the ping on your phone.
- Click Save.
Setting Up Discord Alerts
- In your Discord server, go to Channel Settings → Integrations → Webhooks.
- Create a New Webhook and copy the URL.
- In Uptime Kuma, add a new Discord notification.
- Paste the Webhook URL. If you’re configuring a custom webhook instead of Discord, you might need to send a raw JSON payload. (Our JSON formatter and JSON validator are handy for debugging these).
- Test and Save.
Crucial Step: Notifications are not global by default! When you create or edit a monitor, you must scroll down to the Notifications section and toggle the switch to attach your Telegram/Discord alert to that specific monitor.
If you prefer self-hosted notifications, you can route webhooks to n8n for complex alerting logic.
Securing Your Setup with a Reverse Proxy
Right now, Uptime Kuma is accessible via http://<ip>:3001. This is insecure. You should never expose raw HTTP dashboard ports to the public internet.
We need to put it behind a reverse proxy with automated TLS certificates. I highly recommend using Nginx Proxy Manager (NPM) or Caddy.
If you are using NPM (see our Nginx Proxy Manager security guide):
- In NPM, click Add Proxy Host.
- Domain Names:
status.yourdomain.com. (Ensure you’ve set up the A Record in your DNS provider). - Forward Hostname: The internal IP of your Uptime Kuma server.
- Forward Port:
3001. - WebSockets Support: Turn this ON. Uptime Kuma’s live dashboard relies heavily on WebSockets. If you skip this, the dashboard will constantly disconnect.
- Go to the SSL tab, request a new Let’s Encrypt certificate, and enable “Force SSL”.
- Save.
You can now securely access your dashboard at https://status.yourdomain.com.
Once the reverse proxy is handling traffic, you should configure your UFW firewall to block all external access to port 3001, forcing all traffic through port 443 via Nginx. You can verify your open ports using these Linux security commands. Additionally, if you don’t trust an incoming link that supposedly points to your proxy, use our guide to check a website before clicking a link to avoid phishing traps.
Building a Public Status Page
If you run services for other people — like a Paperless-ngx instance for your office or a Stirling PDF server for your team — they need to know if the service is down without messaging you.
Uptime Kuma has a built-in public status page generator that rivals paid tools like Statuspage.io.
- In the Uptime Kuma sidebar, click Status Pages.
- Click New Status Page.
- Set a slug (e.g.,
system-status) and a title. - You will be taken to a drag-and-drop editor.
- Create a group (e.g., “Web Services”).
- Drag the monitors you want to be public from the right sidebar into your new group.
- Important: You can leave internal infrastructure monitors (like your database pings or Syncthing backups) off the public page entirely.
- Customize the branding, add a custom CSS theme if you want, and hit Save.
Your users can now visit https://status.yourdomain.com/status/system-status to see exactly what is online, complete with 90-day uptime history graphs.
Backup Strategy
Since Uptime Kuma stores everything in a single SQLite database (kuma.db), backups are incredibly easy.
You just need to copy that file. However, you shouldn’t just cp the file while the database is being written to, as it can cause corruption.
A simple backup script looks like this:
#!/bin/bash
# Stop the container briefly
docker stop uptime-kuma

# Copy the database to a backup location
cp ~/uptime-kuma/uptime-kuma-data/kuma.db ~/backups/kuma_$(date +%F).db

# Restart the container
docker start uptime-kuma
When storing backups locally, always verify your Linux file permissions using our Linux permission calculator. The kuma.db file contains your notification secrets, so it shouldn’t be world-readable.
You can automate this script using systemd timers or standard cron jobs. If you need help writing cron syntax, our cron expression generator will output the exact schedule format.
For a complete 3-2-1 backup architecture, sync those database dumps to an offsite cloud provider. Our backup strategies for self-hosted servers guide covers how to encrypt and upload these files using tools like Restic or Borg.
Best Practices and Troubleshooting
1. Alert Fatigue is Real
If you set your monitor interval to 20 seconds and your retries to 1, you will get woken up at 3 AM because your VPS provider dropped a packet. Fix: Set intervals to 60 seconds, and retries to at least 3. You only want an alert if the service is down for a sustained 3 minutes.
2. Monitoring the Monitor
What happens if the server hosting Uptime Kuma goes down? Who monitors the monitor? Fix: You should host Uptime Kuma on a completely separate server from your primary applications. If you host it on the same machine as your websites, a total server crash takes down both the sites and the alerting system simultaneously. A cheap $5 VPS is perfect for this.
3. Blank Screen on Load
If you load the dashboard and get a blank white screen or a constant “Connecting…” message, your reverse proxy is dropping WebSockets.
Fix: Verify that WebSocket support is explicitly enabled in Nginx Proxy Manager, or if using a custom Nginx configuration, ensure the Upgrade headers are being passed correctly.
4. Securing the Host
Don’t neglect the underlying Linux OS. Disable password authentication for SSH (use keys), and install Fail2ban to stop automated brute-force attacks against the server. If you want a complete audit, run through our secure home server checklist.
Alternatives to Uptime Kuma
While Uptime Kuma is my go-to choice, it’s worth knowing the alternatives:
- Statping: Another open-source status page and monitoring tool. Less actively maintained than Uptime Kuma recently.
- Healthchecks.io: Operates on a “cron/heartbeat” model. Instead of Healthchecks pinging your server, your server pings Healthchecks to say “I’m alive”. Excellent for monitoring automated backup scripts rather than continuous HTTP services. Understanding how HTTP works for beginners clarifies why this heartbeat approach is sometimes better than a standard ping.
- Prometheus + Grafana: The enterprise gold standard. Incredibly powerful, but extremely complex to set up. Way too heavy if you just want to know if your website is up. If you’re already deploying apps with Dokploy, a lightweight monitor like Uptime Kuma fits much better.
You can explore more tools like this in our roundup of the best open source alternatives to proprietary software.
Conclusion
Setting up monitoring is usually the last thing people do when building a home lab, but it’s the first thing you wish you had when something breaks.
Uptime Kuma gives you enterprise-grade monitoring, beautiful status pages, and instant push notifications without the monthly subscription fees. Deploy it on a cheap secondary VPS, connect it to your Telegram, and enjoy the peace of mind knowing you’ll be the first to know when a service drops.
For more infrastructure management, explore our Git and GitHub guide to start version-controlling your Docker Compose files, ensuring your configurations are always safely backed up.
Official Documentation
- Uptime Kuma GitHub: https://github.com/louislam/uptime-kuma
- Official Documentation: https://github.com/louislam/uptime-kuma/wiki
- Docker Hub Image: https://hub.docker.com/r/louislam/uptime-kuma
Frequently Asked Questions (FAQ)
What is Uptime Kuma?
Uptime Kuma is an open-source, self-hosted monitoring tool that tracks the availability of your websites, APIs, and servers. It provides real-time dashboards, instant push notifications, and public status pages without relying on third-party cloud services.
Is Uptime Kuma free to use?
Yes. Uptime Kuma is completely free and open-source under the MIT license. There are no paid tiers, monitor limits, or premium features. You only pay for the underlying server infrastructure to host it.
How do I install Uptime Kuma?
The recommended way to install Uptime Kuma is via Docker Compose. You map a volume for persistent SQLite storage and expose port 3001. A single container handles the web dashboard, monitoring engine, and database.
Does Uptime Kuma require a separate database?
No. Uptime Kuma uses an embedded SQLite database (kuma.db) stored directly in its Docker volume. It does not require setting up PostgreSQL, MySQL, or MariaDB, making deployment extremely simple.
Can Uptime Kuma monitor local Docker containers?
Yes. If you mount the /var/run/docker.sock file into the Uptime Kuma container, you can select ‘Docker Container’ as a monitor type and track the exact running state of containers on the same host, even if they aren’t exposed to the network.
How do I get alerts when a site goes down?
Uptime Kuma supports over 90 notification providers. You can configure Telegram bots, Discord webhooks, Slack integrations, SMTP email, and Gotify. You must attach the configured notification provider to each specific monitor in the settings.
Why does the Uptime Kuma dashboard show a blank screen?
If the dashboard fails to load or constantly says “Connecting”, your reverse proxy is likely blocking WebSockets. Uptime Kuma’s real-time UI relies on Socket.io. Ensure WebSockets are enabled in Nginx Proxy Manager, Caddy, or Traefik.
Can I share my uptime status with the public?
Yes. Uptime Kuma includes a built-in Status Page generator. You can select specific monitors to display publicly, customize the branding, and map the status page to a custom domain for your users or clients to view.
How do I back up Uptime Kuma?
Since all data, history, and settings are stored in a single SQLite database file, you simply need to copy the kuma.db file from the Docker volume to a secure backup location. It is recommended to briefly stop the container before copying to prevent file corruption.
Should I host Uptime Kuma on the same server as my websites?
Ideally, no. If you host your monitoring tool on the same physical server as the applications it monitors, a total server crash will take down both your applications and your alerting system simultaneously, leaving you blind.

Discussion
Loading comments...