

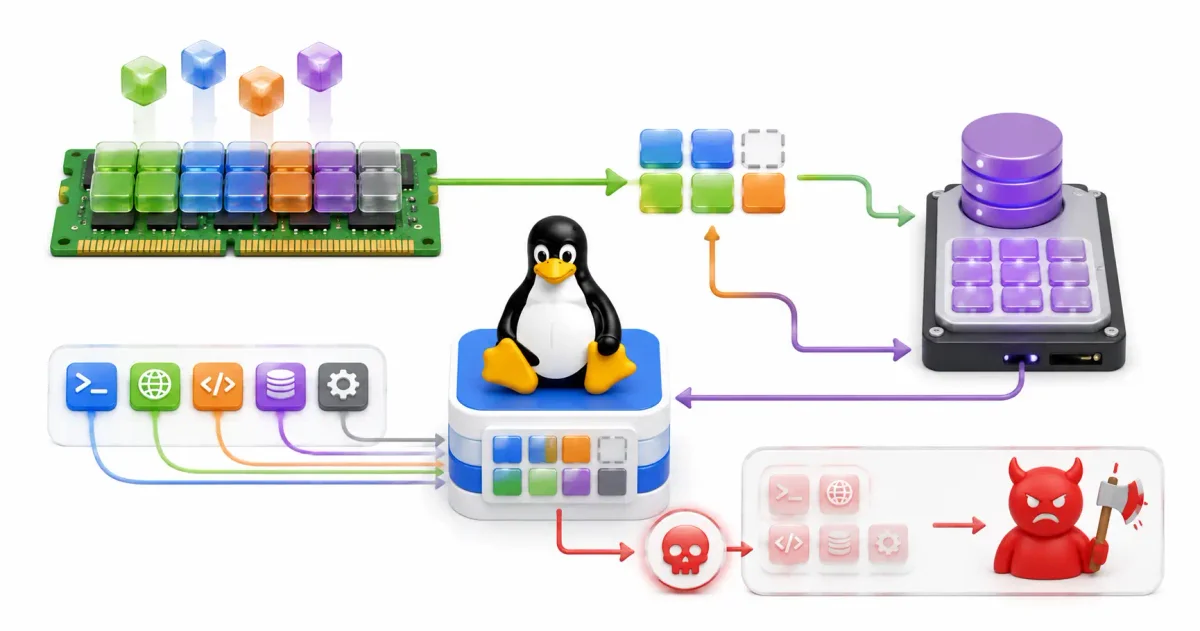
If you have ever executed free -h on a freshly provisioned Linux VPS and panicked because it reported 90% of your RAM was “used”—even though your applications were humming along perfectly—you are not alone. Conversely, perhaps you were self-hosting a memory-hungry PostgreSQL database or running an AI model via Ollama, only to watch the process suddenly terminate with a cryptic Killed message in your systemd logs.
The explanation for both of these phenomena lies deep within the Linux Memory Management subsystem. This subsystem is arguably the most complex and highly optimized component of the Linux kernel, tasked with coordinating finite hardware resources against infinite application demands.
In 2026, where engineers routinely orchestrate Docker and Podman containers and spin up fleets of Proxmox VE virtual machines, mastering Linux memory is no longer optional. In this guide, we will explore the abstractions of Virtual Memory, decode the Page Cache, dissect Zram and Swap architectures, tune the Out-Of-Memory (OOM) Killer, and review the best monitoring tools for production stability.
1. Physical RAM vs. Virtual Memory (The MMU Layer)
Operating systems do not permit user-space applications (like Nginx or Redis) to write data directly to physical RAM addresses. Instead, the Linux kernel abstracts the hardware into a continuous logical layer called Virtual Memory.
When you write a Node.js backend application, the application believes it has access to a massive, contiguous block of memory starting at address 0x0000. In reality, the physical RAM blocks might be heavily fragmented across different hardware sectors.
The Memory Management Unit (MMU)
The translation between the virtual addresses used by your code and the actual physical hardware addresses is performed at blistering hardware speeds by the Memory Management Unit (MMU) inside your CPU. The MMU uses translation databases called Page Tables. To prevent latency, the CPU caches recent lookups in a high-speed hardware buffer called the Translation Lookaside Buffer (TLB).
Why Use Virtual Memory?
- Process Isolation & Security: Every process runs inside its own isolated virtual address space. A malicious script cannot peek into the memory allocated to your Vaultwarden password manager. If a process attempts an unauthorized read, the kernel triggers a Segmentation Fault (Segfault) and terminates the program.
- Expanded Address Space: Virtual memory allows the Linux kernel to allocate more memory than physically exists on the motherboard by utilizing storage drives (Swap) to hold inactive, dormant data.
2. Paging, Page Faults, and HugePages
Linux does not manage memory byte by byte; it chunks memory into fixed-size blocks called Pages. On standard x86_64 architectures running modern Linux distributions like Ubuntu or Alpine, the default page size is 4 Kilobytes (4KB).
Page Faults: Loading on Demand
When a process requests memory, the CPU queries the MMU.
- Minor Page Fault: The requested data resides in physical RAM, but the process’s page table mapping needs to be updated. This takes microseconds.
- Major Page Fault: The requested data is NOT in physical RAM. It must be read from the Btrfs or ext4 filesystem on the SSD. The kernel suspends the application thread, fetches the data from the disk, writes it to RAM, and updates the table. This causes visible application latency.
When 4KB is Too Small: HugePages
If you run QEMU/KVM hypervisors or massive enterprise databases, dividing 64GB of RAM into tiny 4KB chunks creates gigantic page tables. The CPU spends all its time managing the map rather than processing data (TLB trashing).
To optimize this, Linux offers HugePages, which allocate RAM in blocks of 2 Megabytes (2MB) or even 1 Gigabyte (1GB).
To statically allocate 1024 HugePages (2MB each) on a running server:
echo 1024 | sudo tee /proc/sys/vm/nr_hugepages(Note: Many databases recommend disabling Transparent HugePages (THP) because automatic background merging can introduce latency spikes, preferring static allocation instead).
3. The Page Cache: Why “Free” RAM is Wasted RAM
A common source of confusion for junior sysadmins is monitoring a server via htop or Glances and seeing almost zero “Free” memory, even when only running lightweight services like a WireGuard VPN.
Accessing data from a solid-state drive (SSD) is thousands of times slower than accessing it from RAM. To maximize system performance, the Linux kernel aggressively uses all unused physical memory to cache disk data. This is called the Page Cache.
How the Page Cache Works
- You read a large configuration file in Vim or Helix.
- The kernel reads the file from the SSD and stores a copy in the Page Cache (RAM).
- If you open the file again, the kernel serves it instantly from RAM.
Instant Reclamation: Page Cache memory is structurally different from application memory. If a new Docker container spins up and demands 2GB of RAM, the kernel instantly discards 2GB of old cached files and hands the physical RAM to the container. The cache is entirely ephemeral.
Dirty Pages and sync
When an application saves a file, the data is written to the Page Cache in RAM first. The page is now marked as Dirty because the RAM holds a newer version than the SSD. Background kernel threads periodically flush these dirty pages to disk.
If you are about to pull the power plug on a server, run the sync command to force the kernel to write all dirty pages to the disk immediately, preventing data corruption in your Linux filesystem hierarchy.
4. Swap Space & Compressed RAM (Zram)
Swap is a dedicated partition (or file) on your storage drive that acts as an emergency overflow when physical RAM is entirely consumed.
The Swappiness Parameter
The kernel parameter vm.swappiness (ranging from 0 to 100) dictates how aggressively Linux moves inactive application memory to the Swap drive.
- Low Swappiness (e.g., 10): The kernel avoids swapping, keeping processes in physical RAM until absolutely necessary. Ideal for low-latency databases (MySQL, MariaDB).
- High Swappiness (e.g., 80+): The kernel aggressively swaps out idle processes to keep the Page Cache as large as possible.
To check your current value:
cat /proc/sys/vm/swappinessTo set it permanently to 10, edit /etc/sysctl.conf:
vm.swappiness=10Zram: The Modern Swap Alternative
In 2026, writing swap directly to an SSD is highly discouraged for I/O-intensive workloads. SSDs are too slow compared to RAM, and aggressive swapping destroys SSD flash cells.
Instead, modern Linux distributions utilize Zram or Zswap:
- Zram: Creates a compressed block device directly in your RAM. When the system needs to swap, it uses high-speed compression algorithms (lz4 or zstd) to compress the inactive data and store it inside the Zram block. This effectively expands your usable RAM by 200% to 300% with negligible CPU overhead.
- Zswap: A compressed cache that intercepts data headed for a physical disk swap file. It compresses the data in RAM first. If the RAM cache fills up, it evicts the oldest compressed pages to the actual disk.
5. The Out-Of-Memory (OOM) Killer
What happens when your physical RAM is 100% full, the Swap/Zram is full, and a process requests more memory? To prevent the entire operating system from freezing and crashing, the kernel invokes the Out-Of-Memory (OOM) Killer.
Memory Overcommit
By default, Linux permits Memory Overcommit. It allows applications to request massive amounts of virtual memory space, assuming they won’t actually utilize all of it simultaneously. This is highly efficient but carries the risk of sudden memory starvation.
How the OOM Killer Selects a Victim
The kernel assigns an oom_score to every active process. When memory runs out, the OOM Killer terminates the process with the highest score.
- The base score is driven by how much physical memory the process consumes.
- It applies multipliers: it prefers to kill newly spawned, heavy processes rather than old, foundational system daemons like systemd or the OpenSSH daemon.
Protecting Critical Infrastructure
If you host a critical application—like Nextcloud or a Gitea repository—you must protect it from the OOM Killer by adjusting its oom_score_adj.
The adjustment ranges from -1000 (completely immune) to 1000 (kill immediately).
To protect a custom daemon in its systemd service configuration, define:
[Service]
OOMScoreAdjust=-1000
6. How to Monitor Linux Memory from the CLI
When troubleshooting, avoid relying entirely on heavy monitoring dashboards. Familiarize yourself with these core Linux CLI text tools.
The free -h Command
               total        used        free      shared  buff/cache   available
Mem:            15Gi       4.2Gi       2.1Gi       240Mi       9.1Gi        11Gi
Swap:          2.0Gi       120Mi       1.8Gi
Ignore the “free” column. Look entirely at the “available” column. This tells you exactly how much RAM the kernel can provision for new applications without writing to Swap.
Analyzing /proc/meminfo
This virtual file is the source of truth for metrics tools like Prometheus and Netdata.
cat /proc/meminfo | head -n 10It tracks MemTotal, MemAvailable, and SwapFree with granular accuracy.
Tracking Slab Memory (slabtop)
The kernel allocates memory for its own internal data structures (inodes, sockets, file descriptors) using the Slab Allocator. If your application leaks file descriptors, the kernel’s slab memory will bloat, consuming gigabytes of RAM. Track this in real-time using:
sudo slabtop -oOfficial Documentation
- Linux Kernel Documentation (Memory Management): https://docs.kernel.org/mm/
- Red Hat Memory Tuning Guide: https://access.redhat.com/documentation/en-us/red_hat_enterprise_linux/9/html/monitoring_and_managing_system_status_and_performance/
- Sysctl VM Parameters: https://www.kernel.org/doc/Documentation/sysctl/vm.txt
- Systemd OOMD Daemon Documentation: https://www.freedesktop.org/software/systemd/man/systemd-oomd.service.html
Frequently Asked Questions (FAQ)
What is the difference between “Free” and “Available” memory in Linux?
“Free” memory is RAM that is completely empty and unused, which is wasteful. “Available” memory is the total amount of RAM that can be safely allocated to new applications, consisting of the completely free RAM plus the portion of the page cache that the kernel can instantly reclaim.
Why does my application show incredibly high virtual memory (VIRT) usage?
Virtual memory usage includes all memory addresses the application has mapped. This includes shared libraries, memory-mapped files on the disk, and allocated but untouched pages. High virtual memory usage is entirely normal; you should primarily monitor Resident Set Size (RSS), which reflects actual physical RAM consumption.
Should I disable Swap completely if I have plenty of RAM?
No, disabling swap is highly discouraged. Swap acts as a critical safety valve. Without it, sudden anomalous memory spikes will instantly trigger the OOM Killer, terminating your applications or bringing down the entire server environment.
What is Zram and why is it preferred over standard disk swap?
Zram creates a compressed block device directly within your RAM. When the system needs to swap out idle data, it compresses it (often achieving a 3:1 ratio) and stores it in the Zram block. This is vastly faster than writing to an SSD and prevents hardware wear and tear.
How do I safely clear the Linux page cache manually?
If you need to clear the cache (usually only for benchmarking disk speeds), write to the drop_caches file. To drop the page cache only, run: echo 1 | sudo tee /proc/sys/vm/drop_caches. Note that doing this on a production server will cause severe temporary latency as the system is forced to read files from the disk again.
What causes a “Segmentation Fault” (Segfault)?
A Segfault occurs when a process attempts to access a virtual memory address that it does not have permission to read or write, or an address that hasn’t been allocated to its isolated virtual address space. The CPU blocks the operation, and the kernel immediately kills the offending process.
What is Memory Overcommit in Linux?
Linux uses heuristic logic to allow applications to allocate more virtual memory than the system physically possesses in RAM and Swap combined. It assumes that processes rarely use their entire allocation simultaneously. This improves efficiency but risks OOM events if all processes demand their allocated RAM at once.
How does the OOM Killer choose which process to terminate?
The kernel assigns an oom_score to every running process based heavily on its physical memory consumption. When memory is exhausted, the process with the highest score is killed. You can manually protect critical processes like SSH by lowering their oom_score_adj value.
Why do databases like PostgreSQL recommend disabling Transparent HugePages (THP)?
Transparent HugePages run a background kernel thread that automatically attempts to defragment and merge standard 4KB pages into 2MB HugePages. During heavy database load, this background merging process can lock memory regions and cause severe, unpredictable latency spikes.
How can I identify a memory leak in my application?
A memory leak occurs when a program allocates memory but fails to release it back to the kernel. You can track this in production by monitoring the process’s RSS (Resident Set Size) over time using a tool like htop or the ps command. For debugging source code, developers commonly use a profiler like Valgrind.


Discussion
Loading comments...