

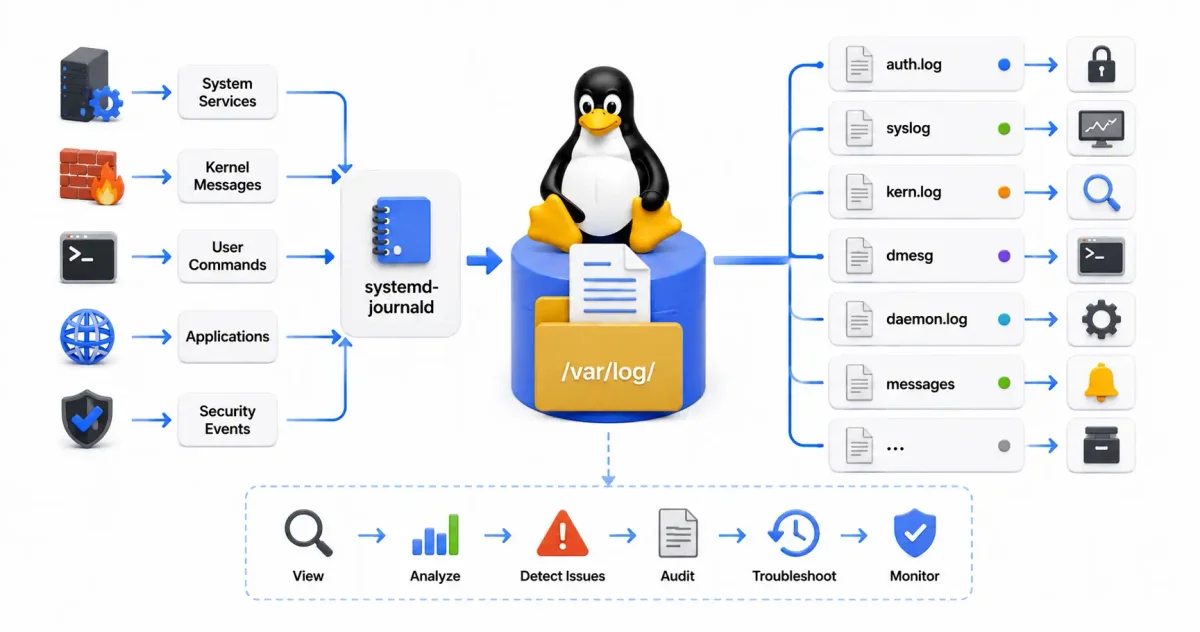
Imagine your Linux system is a massive, complex machine. When something goes wrong—a service won’t start, a login fails, or the system crashes—the machine doesn’t just go silent. It writes down exactly what happened in a “diary” called a Log.
In 2026, understanding how to read and manage these logs is the difference between a frustrated user and a Linux expert. Whether you’re managing a VPS or troubleshooting your desktop distro, this guide will show you exactly where to find the answers you need.
The Two Faces of Linux Logging
Modern Linux systems use two different systems for recording data. Think of them as the “Old School” and “New School” methods.
1. Traditional Syslog (Text Files)
For decades, Linux has stored logs as plain text files in the /var/log directory. You can read these files with standard tools like cat or less. Our guide on the Linux Filesystem Hierarchy explains why /var/log is the designated home for this data.
Traditional logging is managed by a daemon like rsyslog or syslog-ng. When programs run, they send messages to the daemon containing:
- Facility: The category of the program sending the log (e.g.,
authfor security systems,cronfor cron jobs,kernfor the kernel,mailfor mail servers,daemonfor general background services). - Severity/Priority: How critical the event is, measured on a scale from 0 to 7:
0 (emerg): System is unusable.1 (alert): Action must be taken immediately.2 (crit): Critical conditions.3 (err): Error conditions.4 (warning): Warning conditions.5 (notice): Normal but significant conditions.6 (info): Informational messages.7 (debug): Debug-level messages.
Based on rules in /etc/rsyslog.conf or /etc/rsyslog.d/, the logging daemon writes these messages to text files in /var/log/.
2. The systemd Journal (Binary Data)
Modern systems running systemd also use a centralized, binary-format log called the Journal. This is managed by systemd-journald. Because it is stored in a structured binary database, it is faster and collects rich metadata (such as CPU, user ID, and systemd unit), but you need a specific tool—journalctl—to query it.
The /var/log Directory Map: Anatomy of Core Log Files
If you navigate to the /var/log directory on a standard Linux system, you will see a large array of files and subdirectories. Each path has a specific purpose.
The System Log File Reference
| File Path | Log Type | Common Facilities | Description |
|---|---|---|---|
/var/log/syslog (Debian/Ubuntu) or /var/log/messages (RHEL/CentOS) | Master Log | daemon, user, mail | The general system log. Captures all messages except those explicitly routed to dedicated logs. Check this first for general service failures. |
/var/log/auth.log (Debian/Ubuntu) or /var/log/secure (RHEL/CentOS) | Authentication | auth, authpriv | Security checkpoint. Logs SSH logins, failed passwords, sudo usage, user creation, and PAM events. |
/var/log/kern.log | Kernel | kern | Directly records kernel-level alerts, system calls, hardware conflicts, and driver warnings. |
/var/log/dmesg | Boot Log | kern | Holds messages generated during the initial hardware initialization and POST phase. Unlike kern.log, this is written to a ring buffer. |
/var/log/dpkg.log or /var/log/yum.log | Package Manager | user | Logs every package installation, upgrade, or removal via apt/dpkg or yum/dnf. Useful for tracking package updates. |
/var/log/boot.log | Boot Services | daemon | Records startup messages from systemd services during the init phase. |
Classic CLI Tools for Text Logs
Because traditional logs are just massive text files, you use standard GNU Coreutils to read them. You should never open a 500MB log file with a graphical text editor; it will crash your computer.
The Live Monitor: tail -f
The tail command outputs the last 10 lines of a file. However, if you add the -f (follow) flag, it keeps the file open and instantly prints any new lines written to the file in real-time.
- Use Case: If you are trying to fix a broken SSH configuration, you would run
sudo tail -f /var/log/auth.login one terminal window, and then try to log in from another window, watching the live errors appear.
The Paged Reader: less
If you need to read historical logs, use less. It only loads one page of the file into memory at a time, making it incredibly fast.
- Use Case:
sudo less /var/log/syslog. Once insideless, you can pressG(capital G) to jump to the very bottom (the newest entries), and you can press/to search for specific words.
The Search Engine: grep
If you know what you are looking for, grep will extract only the lines that match your query from millions of lines of text.
- Use Case: Find every failed login attempt:
sudo grep "Failed password" /var/log/auth.log.
Mastering journalctl: Querying the Systemd Journal
Since almost all major distros use systemd now, journalctl is your most powerful tool. Because the journal captures vast amounts of metadata, you can execute incredibly precise database-style queries to find exactly what you need.
Essential journalctl Commands
- View everything (most recent first):
sudo journalctl -r - View real-time logs (as they happen):
sudo journalctl -f - Filter by importance (Errors only):
sudo journalctl -p err
Advanced Querying Patterns
Filtering by Service (Unit)
To see only the logs generated by a specific systemd service:
sudo journalctl -u nginx.serviceFiltering by Time Range
Isolate log entries to a specific time window:
# Show logs since yesterday
sudo journalctl --since "yesterday"

# Show logs within a specific time window
sudo journalctl --since "2026-06-24 01:00:00" --until "2026-06-24 02:30:00"

# Show logs from 1 hour ago
sudo journalctl --since "1h ago"
Filtering by Boot Session
Every restart generates a unique boot ID.
# View logs from the current boot session
sudo journalctl -b 0

# View logs from the previous boot session (perfect for crash debugging)
sudo journalctl -b -1
Extra Context Flags
To jump to the end of the log and show details of the last 100 entries:
sudo journalctl -xe -n 100Configuring Journald Limits & Persistence
By default, systemd can store journals in memory (volatile) or write them to disk in /var/log/journal/ (persistent). If not configured, the journal can slowly consume a massive amount of disk space.
You can configure storage limits by editing /etc/systemd/journald.conf. Here is an optimized production configuration:
[Journal]
# Ensure journals are stored persistently on disk
Storage=persistent

# Limit the maximum disk space the journal can consume
SystemMaxUse=1G

# Ensure the system keeps at least 10 Gigabytes of disk space free
SystemKeepFree=10G

# Limit the maximum size of individual journal files
SystemMaxFileSize=128M

# Control how often journal data is synced to disk
SyncIntervalSec=5m
After modifying the file, restart the daemon to apply changes:
sudo systemctl restart systemd-journaldConfiguring Custom Logging and Rotation
Custom Syslog Routing with rsyslog
If you are developing a custom application, you might want to route its log output away from /var/log/syslog into a dedicated file. You can configure this by adding custom rules to /etc/rsyslog.d/.
Create a configuration file 50-myapp.conf:
sudo nano /etc/rsyslog.d/50-myapp.confAdd a rule filtering by program name and writing to a custom file:
# Route all logs from program 'myapp' to a dedicated file
if $programname == 'myapp' then /var/log/myapp.log

# Stop processing the message so it doesn't also print to syslog
& stop
Restart rsyslog to load the rule:
sudo systemctl restart rsyslogLog Rotation with logrotate
As custom log files (like /var/log/myapp.log) grow, they must be periodically rotated and compressed to prevent them from filling the disk. This is managed by the logrotate utility.
You configure log rotation rules by placing configuration blocks inside /etc/logrotate.d/. Here is a custom configuration block for our app log:
/var/log/myapp.log {
    daily               # Rotate the log file every day
    rotate 7            # Keep up to 7 historical files (7 days of logs)
    compress            # Compress rotated logs using gzip (.gz)
    delaycompress       # Delay compression until the next cycle (keeps myapp.log.1 uncompressed)
    missingok           # Do not issue an error if the log file is missing
    notifempty          # Do not rotate the log file if it is empty
    create 0640 admin adm # Create the new empty log file with permissions 640
    sharedscripts       # Run postrotate script once after all logs are rotated
    postrotate
        /usr/lib/rsyslog/rsyslog-rotate
    endscript
}
Log Forwarding & Aggregation at Scale
While reading local logs on a single server is manageable, modern systems rely on clusters of hundreds of servers. Log aggregation engines collect, index, and centralize logs dynamically.
flowchart LR
    A[Server 1: App Log] --> D[Promtail Agent]
    B[Server 2: Syslog] --> E[Promtail Agent]
    C[Server 3: Docker Log] --> F[Promtail Agent]
    D --> G[(Grafana Loki Engine)]
    E --> G
    F --> G
    G --> H[Grafana Dashboard]
The Log Aggregation Tech Stack
- The ELK Stack (Elasticsearch, Logstash, Kibana): The traditional enterprise giant. Logstash processes logs, Elasticsearch stores and indexes the text data, and Kibana provides a dashboard. However, ELK is resource-heavy because it fully indexes every word.
- Grafana Loki & Promtail: A lightweight alternative designed for cloud-native architectures. Loki does not index the full text of logs; instead, it indexes metadata labels (like
service=nginxorenvironment=production). Promtail is an agent that runs on each server, scrapes local log files, and forwards them to Loki.
Sample Promtail Configuration
Here is a sample Promtail configuration (promtail-config.yaml) that monitors /var/log/syslog and forwards it to a centralized Loki instance:
server:
  http_listen_port: 9080
  grpc_listen_port: 0

positions:
  filename: /tmp/positions.yaml # Tracks which parts of the logs have already been read

clients:
  - url: http://loki-central.internal:3100/loki/api/v1/push

scrape_configs:
  - job_name: system
    static_configs:
      - targets: [localhost]
        labels:
          job: varlogs
          host: web-prod-01
          __path__: /var/log/syslog
Real-World Log Analysis Workflows
Knowing the commands is only half the battle. The real skill is applying them to solve concrete problems. Here are four of the most common investigation patterns.
Workflow 1: Diagnosing a Failed SSH Login
A user reports they cannot log in via SSH. You suspect they are being blocked by fail2ban or that the SSH service crashed.
# Step 1: Check auth.log for recent failed passwords from the IP in question
sudo grep "Failed password" /var/log/auth.log | tail -20

# Step 2: Check if fail2ban has banned the IP
sudo grep "Ban" /var/log/fail2ban.log | grep "192.168.1.100"

# Step 3: Cross-reference with journald for the SSH service status
sudo journalctl -u ssh.service -n 50 --since "30 minutes ago"
Typical Finding: journalctl reveals Failed to start OpenBSD Secure Shell Server. This narrows the scope to a configuration file syntax error. You would then run sshd -t to validate the config file.
Workflow 2: Investigating Unexpected Package Changes
Someone on your team suspects an unauthorized software installation occurred on a production server. The package manager log is your primary evidence source.
# On Debian/Ubuntu, filter dpkg log for install events from yesterday
grep " install " /var/log/dpkg.log | grep "$(date -d yesterday '+%Y-%m-%d')"

# On RHEL/CentOS/Fedora
grep "Installed" /var/log/dnf.log | tail -30
This gives you a timestamped record of every package installed. You can then correlate the timestamp against user login records in auth.log to identify who was logged in during the installation window.
Workflow 3: Finding the Root Cause of a Service Crash
Your Nginx web server crashed at 3 AM. The monitoring alert woke you up. How do you figure out why?
# Step 1: Find the exact time of the crash from the previous boot session
sudo journalctl -u nginx.service -b -1 --no-pager | grep -E "(Failed|Error|Started|Stopped)"

# Step 2: Check what happened to system memory around that time
sudo journalctl -k --since "2026-06-24 02:50:00" --until "2026-06-24 03:10:00" | grep -i "oom"

# Step 3: Check the application's own error log
sudo tail -100 /var/log/nginx/error.log
Typical Finding: journalctl -k reveals an Out-of-Memory (OOM) killer event. The kernel ran out of RAM and forcibly terminated the Nginx process to prevent a full system freeze. The fix is to add swap space or optimize Nginx’s worker_processes configuration.
Workflow 4: Using awk for Quantitative Log Analysis
For traffic analysis, grep alone isn’t enough—you need to count and aggregate data. awk is the tool for this.
# Count the frequency of each unique IP address hitting your Nginx access log
sudo awk '{print $1}' /var/log/nginx/access.log | sort | uniq -c | sort -rn | head -20

# Count HTTP status code distribution (how many 200s, 404s, 500s?)
sudo awk '{print $9}' /var/log/nginx/access.log | sort | uniq -c | sort -rn
This produces a ranked list showing which IP addresses are making the most requests and whether your server is returning a worrying number of 500 Internal Server Error responses.
Monitoring Security Events in Auth Logs
The /var/log/auth.log (or /var/log/secure on RHEL systems) is arguably your most important security file. Here is a systematic approach for security monitoring.
Detecting Brute-Force Attacks
# List all IPs with more than 10 failed login attempts
sudo grep "Failed password" /var/log/auth.log \
  | awk '{print $(NF-3)}' \
  | sort | uniq -c | sort -rn \
  | awk '$1 > 10 {print $1, $2}'
Monitoring sudo Privilege Escalation
Every time any user executes a command with sudo, it is logged with the command used and whether it was allowed or denied.
# See all sudo events by a specific user
sudo grep "sudo" /var/log/auth.log | grep "username"
A pattern of incorrect password attempts followed by a successful sudo may indicate a compromised account attempting privilege escalation.
Automating Alerts with fail2ban
Manually scanning auth logs is not scalable. fail2ban is a daemon that automatically reads your log files, detects defined attack patterns using configurable regular expressions, and adds temporary firewall rules to block offending IP addresses.
A basic /etc/fail2ban/jail.local configuration for protecting SSH:
[DEFAULT]
# Ban IPs for 1 hour
bantime  = 3600
# Detect patterns within a 10-minute window
findtime  = 600
# Trigger ban after 5 failed attempts
maxretry = 5

[sshd]
enabled = true
port    = ssh
logpath = %(sshd_log)s
backend = %(syslog_backend)s
Docker and Container Logging
When you run applications inside Docker containers, logs don’t go to /var/log. Instead, Docker captures everything the container writes to stdout and stderr and manages it through its own pluggable logging driver system.
Viewing Container Logs
# View the last 100 log lines from a container named 'my-api'
docker logs --tail 100 my-api

# Stream live logs from a container (equivalent to tail -f)
docker logs -f my-api

# Show timestamps alongside each log entry
docker logs -t my-api

# Filter logs within a time window
docker logs --since 2026-06-24T01:00:00 --until 2026-06-24T02:30:00 my-api
Forwarding Container Logs to Syslog
For production environments, you want to centralize container logs alongside your system logs. Configure Docker to forward logs to the local syslog daemon by creating or modifying /etc/docker/daemon.json:
{
  "log-driver": "syslog",
  "log-opts": {
    "syslog-address": "unixgram:///dev/log",
    "tag": "docker/{{.Name}}"
  }
}
Restart the Docker daemon (sudo systemctl restart docker) and all container logs will now flow into /var/log/syslog with the tag docker/container-name, making them queryable alongside all your other system events in a single unified view.
Frequently Asked Questions About Linux Logs
How do I check logs for a specific application crash?
For systemd-managed services, sudo journalctl -u servicename.service -n 100 --no-pager is the fastest approach. Add -b -1 to look at logs from the previous boot if the crash caused a restart. For applications with their own log files (like Nginx or MySQL), check the application’s dedicated log path in /var/log/.
How do I clear or empty a log file without deleting it?
Never use rm on an active log file, as the daemon still has a file handle open and will keep writing to a now-orphaned inode. Instead, truncate the file in place:
sudo truncate -s 0 /var/log/myapp.logAlternatively, the proper way to purge journal logs is:
# Delete journal logs older than 2 weeks
sudo journalctl --vacuum-time=2weeks

# Delete journal logs until total size is under 500MB
sudo journalctl --vacuum-size=500M
Why do my log files keep filling up the disk?
This is typically a sign that logrotate is not configured for that specific log file. First, check if a logrotate rule exists for the path: cat /etc/logrotate.d/. If the application’s log is missing, create a custom configuration block as demonstrated in the “Log Rotation” section above. Also verify logrotate is actually running: sudo systemctl status logrotate.timer.
What is the difference between syslog and journald?
They are parallel, complementary systems. syslog (via rsyslog or syslog-ng) stores logs as plain-text files in /var/log/. journald (via systemd-journald) stores structured binary logs in /var/log/journal/. Many modern systems run both simultaneously. journald captures everything from the kernel and all systemd services; rsyslog can be configured to read journald entries and write them back to text files for compatibility with traditional tools.
Can I read logs from a crashed system that won’t boot?
Yes. Boot from a Linux Live USB, mount your broken system’s hard drive, and navigate to the mount point. Traditional log files in /var/log/ are fully readable as plain text. Journal logs require you to specify the path: journalctl --directory=/mnt/brokenroot/var/log/journal.
Conclusion
Linux logs aren’t just for experts; they are the most valuable resource for anyone learning the system. The layered architecture—structured binary journals from journald alongside traditional plain-text files managed by rsyslog and protected by logrotate—gives you powerful, flexible control over every event your system generates.
The next time something feels “broken,” don’t guess—check the logs. Open your terminal, invoke journalctl -xe or run tail -f /var/log/syslog, and let the system explicitly tell you what went wrong. Mastering logs shifts your role from a user who reboots and hopes to an engineer who diagnoses and solves.
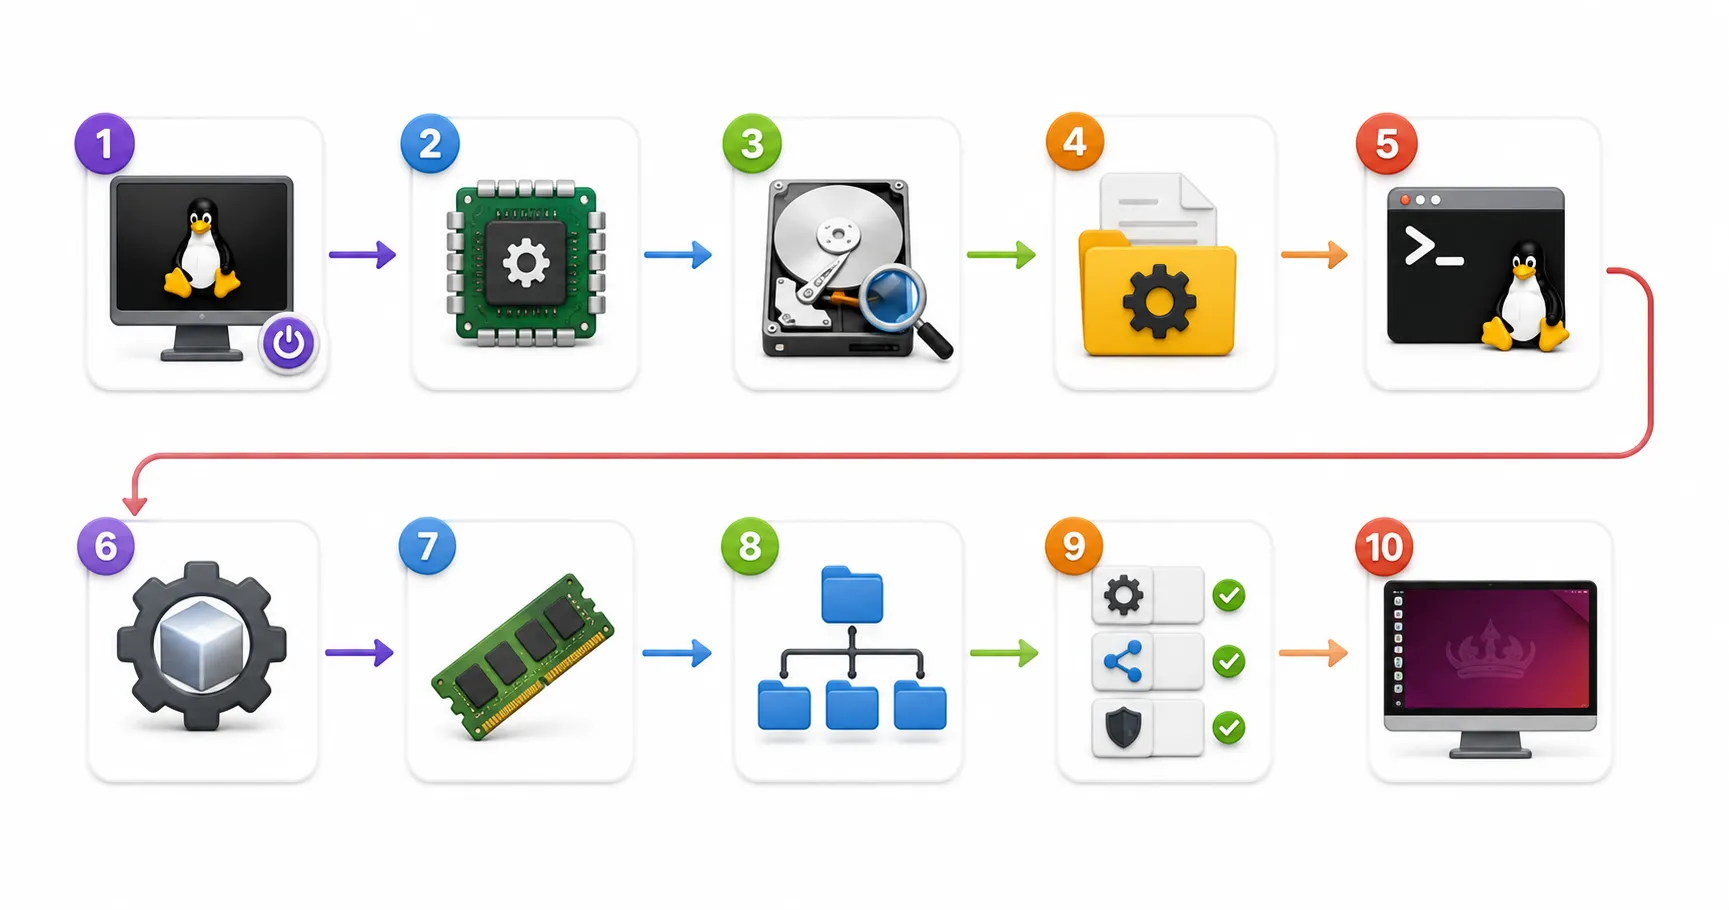
Ready to dive deeper into system internals? Now that you know how to read the logs, learn how to manage the services creating those logs, or explore the Linux Boot Process to see where the very first log entries come from!

Discussion
Loading comments...